Look up typical weather conditions for anywhere instantly
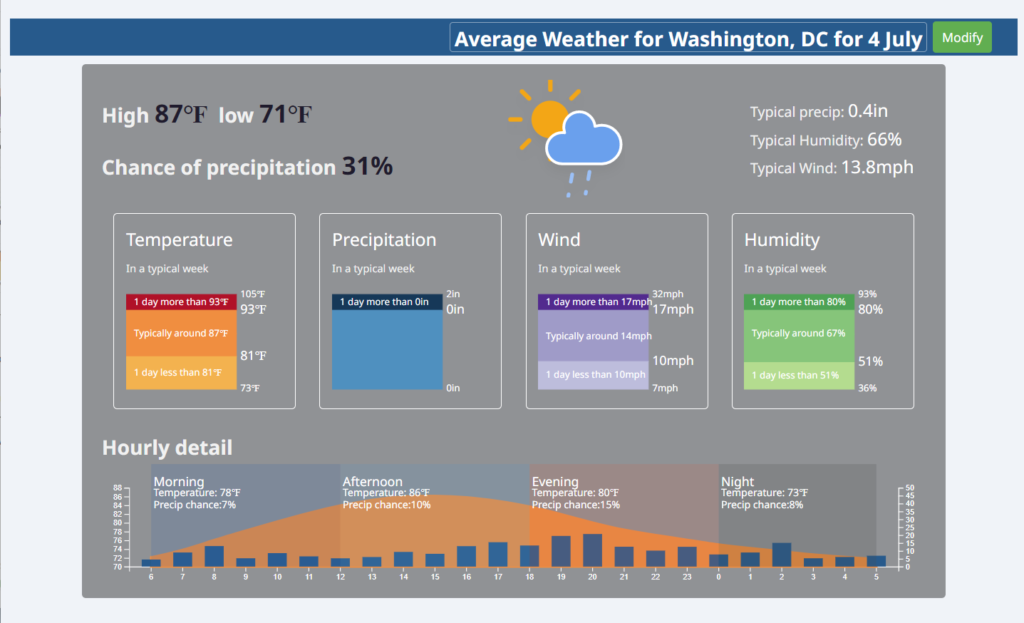
Find typical weather conditions by searching for a city, zip code, or address. If you want to select a specific date on the next page, simply click on the Modify button in the upper right.
It is easy to find the typical or average weather for any location on any date:
- Visit https://www.visualcrossing.com/average-weather
- Enter your location and your date
- Click the Load Weather Data button
- View Dashboard showing the typical weather conditions for that date. These results include detailed temperature, precipitation, wind, and more including how these weather conditions change throughout the typical day.

Valuable planning tool
There are many situations where you want to know the typical weather for a given location. If you are planning a vacation or scheduling a special event, you likely have various dates and destinations among which you can choose. In this case, the Average Weather dashboard can give you an instant idea of what to expect at various destinations and times. Is it better to take your Universal Studios vacation in mid June or late August? Should you schedule your flights to Universal in Orlando or Hollywood for the best weather experience?

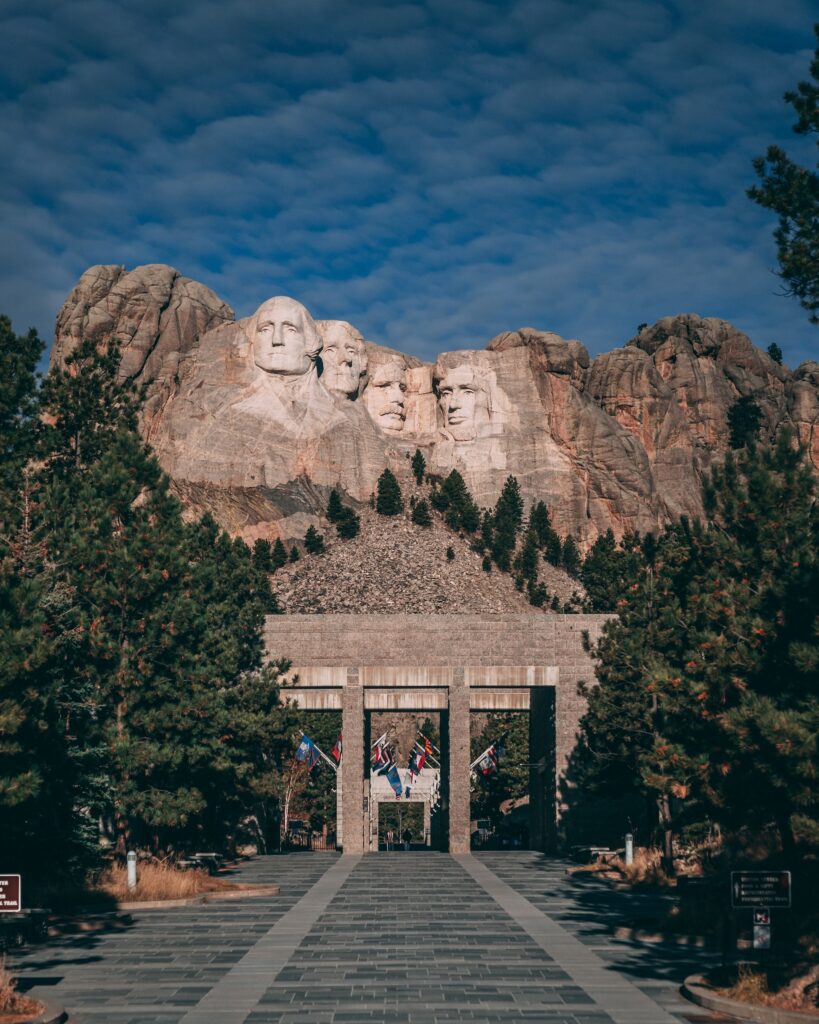
If you are planning to visit Mount Rushmore, you already know that it involves outdoor walking and viewing from a distance. Good weather including sunshine and visibility are important for you to enjoy magnificent views of this massive carving. Visibility is especially important if you are hoping to catch a glimpse of Phillip Vandamm's house at the top as famously seen in Alfred Hitchcock's North by Northwest. (Unfortunately, you would need visibility both to Hollywood, more than 1000 miles away, and back in time to see this masterful cinematic illusion outside of the film. Entirely a fabrication for the movie, Vandamm's house was the combination of a matte painting and a set specially constructed and long ago demolished on an M.G.M. backlot. )
Other times, you already have a fixed destination and date, and just need to plan or pack appropriately. If you have a wedding invitation, a ticket to a conference, or a jobsite schedule, you can easily use the Average Weather dashboard to determine what clothes to prepare or the proper schedule for worksite activities to avoid being surprised by the weather.
Of course, once your event is in the range of a 15-day, model-based forecast, then that traditional forecast becomes a more accurate predictor for your plans. In this case, use our Weather Forecast dashboard instead. However, until you are within a 15-day range, using typical weather, based on average climate patterns, is the best option.
Access via an API
If you are developing an application, tool, or website, and want to use typical weather results, Visual Crossing makes that easy via the Timeline Weather API. This API provides a seamless view of the weather for any location across time. If you request a date in the past, it will return historical weather data. If you request a date within the next 15 days, it will return a traditional, model-based forecast. If you request a date beyond the standard 15-day forecast, it will automatically calculate the typical weather conditions based on normal climate patterns seen over the past decades.

Using the Timeline API, you can easily include all types of past and future weather data into any application or webpage. In the case of typical weather, the complex calculations made across decades of weather data, can be retrieved with a single, simple URL request. If you have not already done so, you can sign up for free and begin using the Visual Crossing Weather API instantly.
How it works
Typical weather conditions are calculated by running statistical algorithms over decades of historical weather data day by day and hour by hour. Our Weather Engine uses these to find the most typical conditions as well as the extremes that are likely to be seen at your location. The hour-by-hour analysis also identifies specific patterns within individual days. It is obvious that temperature patterns would change throughout the day, with the morning and evening usually cooler than midday. However, in many cases rain showers follow intraday patterns also. Depending on how the wind blows cross water or from nearby mountains, for example, rain may be far more common at certain periods of the day during a particular season.
Doing this calculation involves processing a million or more weather records across decades and multiple near-by reporting stations to find the most reliable patterns. In addition, it is useful to realize that days of the year that are close to each other temporally will have similar weather patterns when averaged over years. That is, from the standpoint of weather statistics over decades, the conditions at a given location on July 4th are identical to those on July 3rd and 5th. In fact, every day of any given week are likely to be similar. This allows you to get many more weather samples for any given date. However, it greatly increases the processing effort as well. Our Weather Engine has been optimized to do this work faster than you can read this sentence.

Of course, you could calculate these typical weather patterns yourself by querying hourly, raw weather records for the past 30 years and then running your own statistics using them. The raw historical records are available via the Visual Crossing Weather API. However, you would need to retrieve more than a quarter of a million records for a single location (24 hours * 365 days * 30 years). If you wish to consider multiple stations nearby the location, as the Visual Crossing Weather Engine does, you would need to multiply that record number by the number of stations. Also, if you want to consider temporally nearby dates, that would require even more raw records. Armed with this data, you could then use an analysis package such as R Studio or write your own in calculations in a language such as Python or Java. In fact, some of our customers have custom calculations and analysis that requires this level of effort. However, for anyone looking for simple access to typical weather conditions for any location on the globe, Visual Crossing's Weather Engine will do this work for you.
It is also worth noting the limitation of this form of statical weather. Averages and statistical calculations produce estimations of what weather conditions have generally occurred on any given day. Depending on your specific use case, it can be important to consider the extremes as well. Just because the July 4th temperature in Washington DC is typically between 71F and 87F, the records show a 30-year extreme of 105F around that date. And even though it only occasionally rains on the 4th and quite rarely in the morning, in some use cases you must make sure to account for those rare events. Even beyond that, record conditions are made to be broken. Some year, that all-time temperature high will be broken again. So, while our typical weather calculations are an excellent planning tool and the best weather profile available using 30-years of raw data, there is no such thing as a guarantee when it comes to weather prediction.
Summary
Typical weather conditions based on climate patterns are easy to find and use via Visual Crossing Weather. Our Average Weather dashboard can show you the typical conditions, hour by hour, for any day or the year in any part of the world. You can get this same data using our Timeline API as well. These typical weather conditions can then be used to drive planning applications, websites, or your own custom analysis. As long as you understand the limitations of these statistics-based estimations, they are the easiest and best way for you to plan beyond the range of the typical 15-day forecast.
