While it is very easy to load weather data into Google Sheets via CSV, loading JSON can seem a bit more challenging. However, for the savvy Google Sheets user, loading JSON weather data from the Visual Crossing Timeline Weather API is almost as easy as using CSV and offers additional benefit and functionality that CSV can’t. In this article we will show you how to load different portions of the Timeline Weather API JSON into Google Sheets, and the benefits that can bring to your Google Sheets analysis.
Setting up the JSON parser
Unfortunately, Google Sheets does not, as of this writing, have a built-in JSON importer like Excel does. So the first step is to install a JSON parsing script written in Google’s App Script. While this may sound complex, it is actually trivial and can be done in less time than it takes to read this article section.
Fortunately, there are several good JSON scripts for Google Sheets available as opensource on GitHub. For this article, we will use Brad Jasper’s ImportJSON. As its name implies, ImportJSON is designed to bring to JSON what Google Sheets’s own ImportData() function does for CSV. (Note that there are other JSON scripts for Google Sheets and if you have already used one in the past, you can likely use it for this exercise as well since the functionality is generally the same across the various scripts. However, you will likely need to tweak the parameters if you are using a different JSON script. So, check your script’s documentation for details. Also, if you plan to use another JSON script, either install it instead of the one described below. Or, if you already have your script installed, simply skip the installation portion below.)
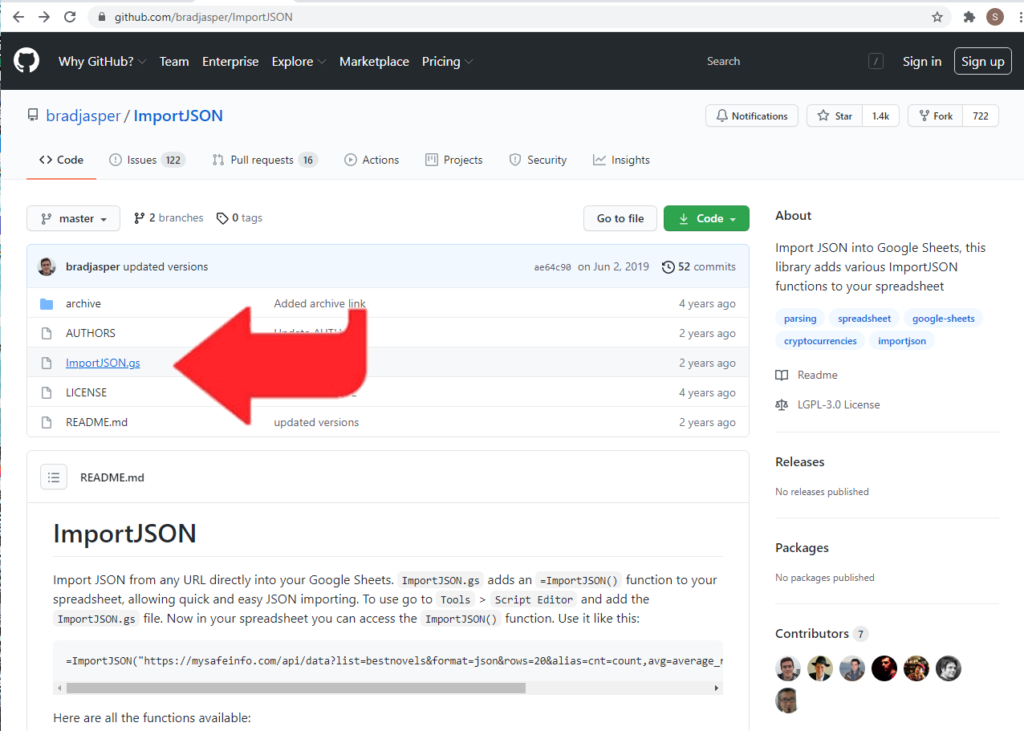
To load the ImportJSON script into your Google Sheets workbook, first create a new workbook or open the existing workbook into which you want to add weather data. Go to the “Tools” menu and select “Script editor” option. This will open up a separate browser tab showing you the skeleton of an App Scripts function. Delete all of this skeleton text in its entirety because you will be pasting in a fully-functional, JSON-handling script. Next go to the ImportJSON project on GitHub: https://github.com/bradjasper/ImportJSON. This link is the top-level page for the project, and there you can read about the script usage and history. However, if you just want to copy-and-paste the script into your workbook, click on the ImportJSON.gs file as shown in the screen show.

Clicking on the ImportJSON.gs file link will open the script’s source file in GitHub’s standard viewer. You can either select the file contents in that view or click on the “Raw” link in the upper right. If you click “Raw” the script file content alone will open in that tab, and you can just use your “select all” key combination to select the entire content.
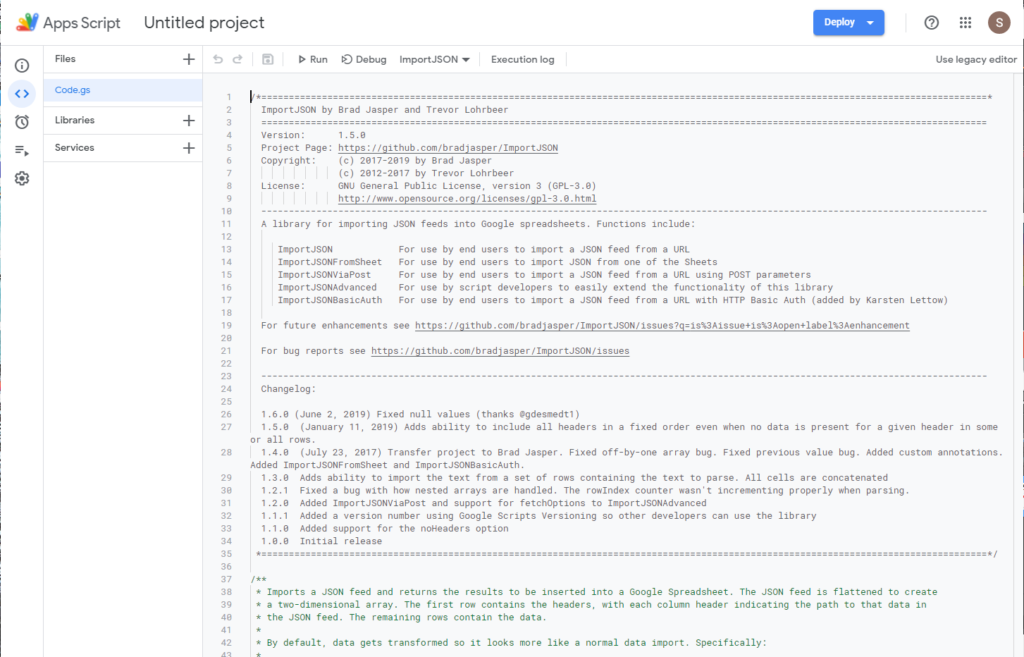
Either way, once you have the file content copied, paste it into the waiting App Script tab from Google Sheets that you opened a moment ago. Your App Script window should then look like the screenshot below. Scroll to the bottom to make sure that you have paste in the entire script, and then hit the save icon on the toolbar in the upper left.

Importing JSON weather data
Now that you have installed the script into your Google Sheets workbook, you are ready to begin loading weather data. The first step, of course, is to set up your weather API query. You can do this easily using the Visual Crossing Timeline Weather API. If you don’t already have an account you can either sign up for free, or use a sample demo query such as this forecast query for Springfield, IL found on the Weather API page.
https://weather.visualcrossing.com/VisualCrossingWebServices/rest/services/timeline/Springfield%2CIL?unitGroup=us&key=AHBS12DVFHFFSHF764DGDB
(Note that this query uses a special API Key that can only query Springfield, IL. You will need to use your own API Key if you want to query other locations. Notice also that we have encoded the location name to be URL friendly. This is important. If you don’t do this, you will get an error as unencoded special characters cannot be used directly. If you need help encoding a portion of your query URL, you can use any of the various web-based URL encoders to do the task. Just make sure to encode only the location and not the entire URL. Encoding the entire URL will result in a malformed URL and an error.)
Our first, basic weather data import
The simplest way to load the weather data is to plug this URL directly into the ImportJSON() function. To do so, enter the following value into the upper-left cell on your fresh Google Sheet.
=IMPORTJSON("https://weather.visualcrossing.com/VisualCrossingWebServices/rest/services/timeline/Springfield%2CIL?unitGroup=us&key=AHBS12DVFHFFSHF764DGDB")
After loading for a second, Google Sheets will show the entire JSON result set flattened to a tabular format. You can see that the raw data is there even though this flattened form has some anomalies that make it difficult to use. For example, if you look at the far left potion of the sheet, you will see that each day’s weather measures are repeated 24 times, once for each hour in the day. If you scroll to the right, you will see that those 24 rows actually contain the hourly detail within that day. If you keep scrolling to the right, you will find some station data and other bits that were flattened unhelpfully by the JSON script.
So while you could clean up and use this data if you wanted, it is not ideal. In order to clean this up, we can use parameters on the ImportJSON() function. The second parameter to the ImportJSON() function is used to ask it to limit the import to a single section of the JSON, and this will help to get the data formatted more usefully.
=IMPORTJSON("https://weather.visualcrossing.com/VisualCrossingWebServices/rest/services/timeline/Springfield%2CIL?unitGroup=us&key=AHBS12DVFHFFSHF764DGDB", "/days")
This query limits the loaded results to only the “days” array of the results JSON. If you replace the top-left cell of your Google Sheets with this new query, you will see that we have now loaded a more cleanly formatted version of our data. The left portion of the grid shows the data with the right portion showing the individual hours as before. However, the extraneous values to the right are gone. This data is in a more usable format.
Importing hourly weather data only
The new filtering parameter allows us to filter down to only the hours for a given day. To show this, we will use a query URL for a single day of historical weather data again taken from the weather API demo page.
https://weather.visualcrossing.com/VisualCrossingWebServices/rest/services/timeline/Springfield%2CIL/2021-01-01?unitGroup=us&key=AHBS12DVFHFFSHF764DGDB
This URL fetches the historical weather conditions for Springfield on 1/1/2021. In order to load only the hourly data for this result, we will tell the ImportJSON() function to only load the “hours” data array within the “days” array by changing our ImportJSON() call to look like this.
=IMPORTJSON("https://weather.visualcrossing.com/VisualCrossingWebServices/rest/services/timeline/Springfield%2CIL/2021-01-01?unitGroup=us&key=AHBS12DVFHFFSHF764DGDB", "/days/hours")
If you replace the query in the first cell of your sheet with this one, you will see that only the hourly data is loaded. You can do other filtering and use additional parameters as desired to obtain the results that are best suited for your use case.
Importing current conditions
The current weather conditions for a location are very useful for many use cases yet it is impossible to obtain them with CSV. Luckily, it is very easy to do so with a slight modification of our ImportJSON() parameters. To demonstrate this, we will return to the forecast query URL. However, when we enter the ImportJSON() function into our sheet, we’ll change the filter parameter to look like this.
=IMPORTJSON("https://weather.visualcrossing.com/VisualCrossingWebServices/rest/services/timeline/Springfield%2CIL?unitGroup=us&key=AHBS12DVFHFFSHF764DGDB", "/currentConditions")
If you enter this query into the first cell of your Google Sheet, you should see a single row of result data. This row shows the mostly recently reported weather conditions at the queried location. In our example, that location is Springfield, IL.
Summary
Loading JSON weather data into Google Sheets is almost as simple as loading CSV data. However, JSON data offers several additional options that are unavailable with CSV data. Among the most valuable of these additions is the ability to fetch the current conditions at a given location. Of course, being able to use JSON data also allows you access to the power and flexibility of the Timeline Weather API including its ability to provide far distant forecasts based on historical climate data.
If you have any questions about using the Visual Crossing Timeline Weather API or our weather data in general, you can reach out to our weather experts. We’ll be glad to help you get the weather data that you need.
