Finding weather data on the internet is easy. While finding historical weather data is a little more difficult, there are various places to find data including free consumer sites, government data feeds, and commercial services and APIs. However, the easiest data sources to find tend to be the hardest to use and the least complete. Commercial services are easier to use and often provide high-quality data, but the cost can be outside the budget of those not in the Fortune 500. In this brief article we will show you a better way to get historical weather data and explain why our solution is superior to the other options available.
Common historical weather data sources
There are several historical weather data sources that come to mind immediately when thinking about data provider options. The first source is the national weather service itself, either the US National Weather Service or its counterpart in your own local country. While these services often offer free data, they are complex to use and using their datasets require the ability to parse hundreds of gigabytes of data in custom formats just to find a single record. One of the most significant data offering is the ISD or Integrated Surface Database. It contains more than 600 gigabytes, 35,000 stations, and scrapes of data all the way to 1901. Sifting through that behemoth to find the specific weather data that you need would take a team of developers and a major coding effort. Even then, it is useful to note that this dataset contains on a small number of the total weather stations available worldwide.
Some consumer weather sites also provide historical weather data. If you are willing to plow through the ads and often cluttered UI, you can find historical weather records for one location and one date at a time. While data on these sites is free, finding the exact data piece that want can be difficult and they are not designed for programmatic use. So, without manually retyping the data from the screen into your own document, it is usually difficult to get the historical weather data into a format that you can use outside their web UI. In addition, if you need to query more than one location or date, you have to enter each request manually. That makes these sites useless for all but the most basic single-lookup cases.
Making historical weather data accessible
Weather data services provide a much better option for anyone who needs easy access to reliable, high-quality weather data. The best ones allow querying using both a web-based user interface and an API that can be automated. If done well, both of these options allow you to easily query historical weather data for multiple locations and time ranges. The result data can then be available as a tabular file to download for further analysis or as formatted data structures to be parsed by code.
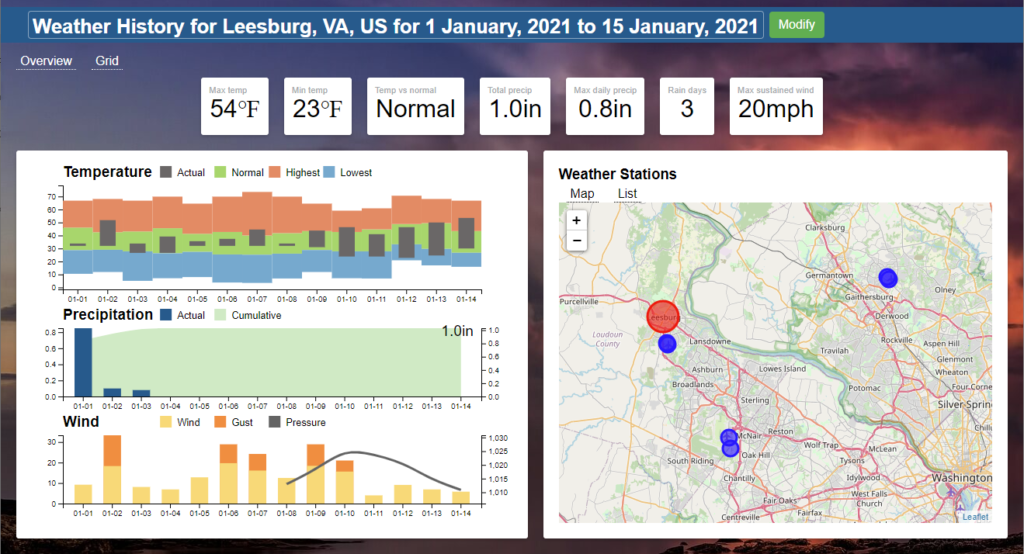
In an ideal service there would be multiple levels of data access depending upon the specific weather data needs. The first level would be a clean and simple weather dashboard webpage. This allows a user to easily query data for a single location and date range and see the results visually.

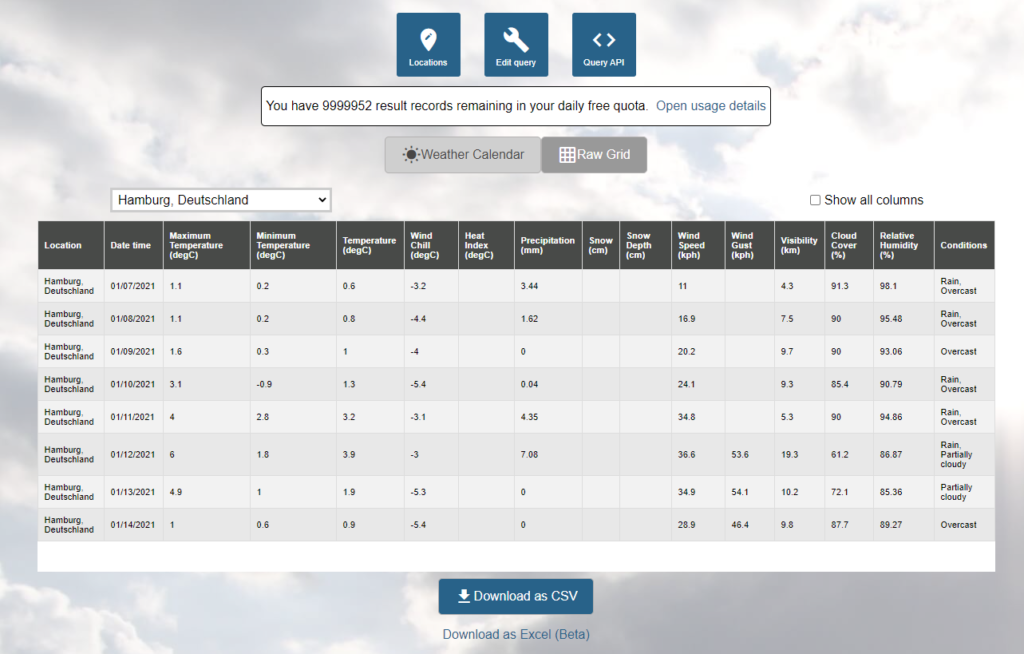
The next level would be a web-based query interface that is simple to use and not cluttered with ads. This interface would allow any user to set up their queries for multiple locations and date ranges in the interface and get immediate results. These results can either be viewed directly on the screen or downloaded as a CSV file. Even better would be if this query building process could result in a reusable API query that could be used to repeat the same query later in script or code.

If you need to embed weather data in a script or code, then you will want to use a weather API. A quality weather service provided a flexible, scalable API that allows you to query weather data from within any script of coding platform such as Javascript, Python or Java. Javascript can be used to in websites and to build custom plug-ins for various tools. A Python or Perl script can be used to populate weather data into a business data warehouse or load data into other applications for further analysis. Java or C++ code can be used to build mobile apps or enterprise applications that bring weather data and analysis to unlimited user populations.
The final key feature of an accessible weather data service is price. A service that costs hundreds or thousands of dollars to get the data that you need isn’t accessible to most people or even small businesses. An ideal service would allow you to get started using weather data for free and only charge based on the actual data that you retrieve. Of course, it would also help to have additional levels and subscription options to make large quantities of data available at a reasonable price should your weather data needs expand in the future. An ideal weather service would provide pricing options that scale with your needs from free, to pennies, to enterprise-level subscriptions.
Ensuring high-quality historical weather data
Even the most accessible weather data is not useful unless the data itself is of high quality, gap filled, and checked for errors. Even the premier US National Weather Service data product, ISD, mentioned above has about 35,000 stations of which about 14,000 are active. However, there are more than 100,000 weather stations reporting around the globe. Bringing in data from multiple sources is key to providing a complete and robust picture of the weather for any given location worldwide. Visual Crossing Weather pulls stations and sources from all around the world to provide the best weather coverage available.
Another key way to increase weather data quality is to compare reports from multiple stations and interpolate nearby stations to provide the most complete and accurate weather conditions for any location. The Visual Crossing Weather data ingestion process compares input records to ensure that they are within valid ranges and congruent with other weather measurements taken nearby. Bad reports are discarded automatically and the interpolation process fills those missing results in with adjusted data from the closest stations possible.
Visual Crossing Weather even goes a step further for people who really want to understand their data and its sources. Each weather record returned reports the specific stations that were queried to provide the results. In addition you can change the station search parameters used by the weather engine dynamically. You can adjust the number of stations being searched and the search radius. This allows you manually control the query for especially remote or difficult locations. While most users never need to make these adjustments, if you want to become a weather expert or have an especially thorny problem to solve, then the power of the weather engine is yours to control.
Summary
While historical weather data is available from various sources across the internet, they are not all created equally. National weather service data feeds tend to be extremely complex and difficult to work with. Consumer web pages can be an easy way to find weather for a single location and date. However, if you have the need to query the weather for more than one location or more than one date, then a weather data service is your best path. Visual Crossing Weather is uniquely positioned to provide high-quality weather data at a cost affordable to everyone. You can get started for free and query small amounts of historical weather data for free perpetually. If you need more data, the Pay-as-you-go plan charges only $0.0001 per historical weather record with no minimum and no recurring subscription fees. However, for users who prefer to buy a monthly plan to run millions of queries, the Professional plan is only only $35 per month.
One final feature of a great weather data service is their support. If you have any questions about using weather data in general or Visual Crossing Weather specifically, simply reach out to our weather experts. You can also search our examples, online help, and tutorials. Just tell us about your weather use case and we’ll be glad to help you get the weather data that you need.
