When you create a simple historical summary, the weather variables are summarized by their default aggregation method for all time periods in question. For example, the maximum temperature is the maximum temperature for all the selected time intervals. Precipitation is the mean across the same time time intervals.
In many cases, we don’t want the overall maximum or sum etc. We want the daily summary so we can know the typical weather we might experience. For example “What is the normal daily high temperature for January in New York?”
The ‘normal’ high temperature is not the maximum of the maximum temperatures – it is the mean of the daily high temperatures. It can be also useful to know the minimum daily high temperature. All three statistics combined give complete information on the high temperature for a given location – the maximum ever experienced, the minimum experienced and the normal (mean).
NOTE
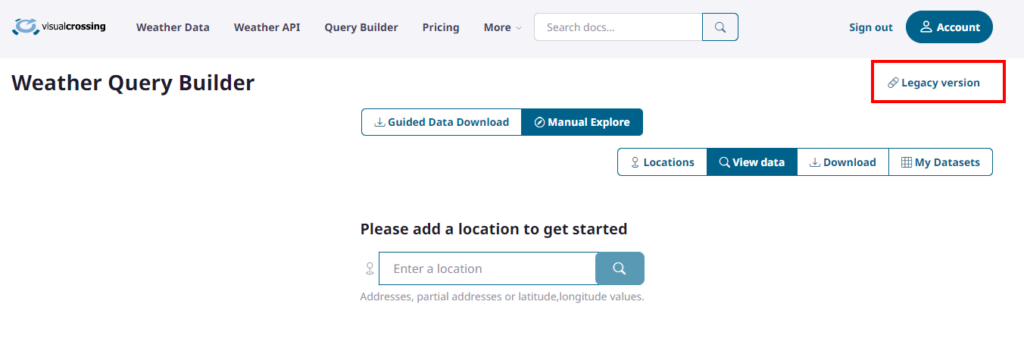
This Article refers to the legacy query interface. if you are already logged in , you can access the legacy page by clicking the link to the ‘legacy version’ as shown in the screenshot below

Adding the daily statistics to a historical summary
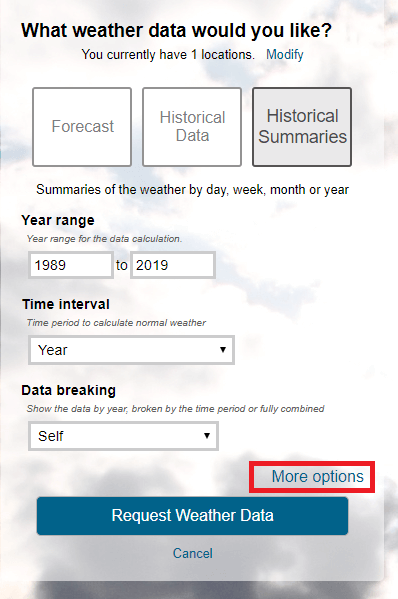
Historical Summary reports can return these extra daily statistics by enabling the “Create daily summary statistics” feature . This can be found under the “More options” link in the historical weather definition editor:

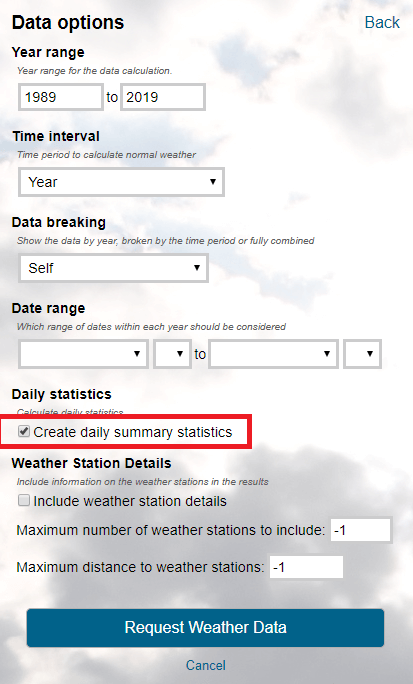
Then within the options enable the ‘Create daily summary statistics’ checkbox.

When this is enabled, daily statistics are returned for many weather variables. This will include the minimum, average and maximum at the daily level. For example, the following parameters will be returned for temperature:

What this data shows is that the normal (ie mean) high temperature is 77.2F but the maximum ever high temperature is 96.2 and the minimum ever maximum temperature is 62F.
Weather API parameter
The above setting is the &dailySummaries=true parameter in the Weather API.
