
Estimated reading time: 9 minutes
Many times, we find ourselves needing a weather forecast beyond the next couple of days. Maybe you are planning an outdoor party, trip, or hoping for a snow day! What is the best way to determine the likely weather for a date further out than the reliable weather forecast?
Try our free weather forecast tools
Our weather forecast page shows the next 15 days forecast plus the typical weather for 30 days into the future. It also shows recent weather history.
Find the typical weather for any global location on any day of the year using our average weather dashboard.
The first question we ask ourselves is whether I should rely upon long-term forecasts or if understanding the typical weather averages for that area has more value. The answer is not as clear-cut in all cases, and it almost always relies upon availability and accuracy of the forecast data, as well as your needs for the data and the timeframe.
In this article, we will discuss the right time to utilize long-term forecast tools.
Weather Forecast Accuracy
Let’s start with the forecast accuracy. The reason to start here is simple: if the long-term forecasts had high accuracy, we would simply always choose them. NOAA explores this question and has come up with the following rule of thumb.
A 5-day forecast is correct about 90% of the time, a 7-day forecast is 80%, and beyond that, the forecast becomes less reliable. If you read this as a binary right/wrong, then statistically speaking, this doesn’t say a lot for our forecasting capability outside of one week, and you simply should not trust it.
But this raises a simple question that is almost impossible to answer, which is “what determines if a forecast is accurate?”
If a temperature prediction is off by 3 degrees, is that considered a failed prediction by the forecasters in a 10-day forecast? Over what period of time are we judging the forecaster to say they are only correct 50% of the time?
This article discusses when exactly forecasters are considered wrong and why they are considered to be slightly wrong most of the time. It’s simply impractical for us to know the current state of the atmosphere and be able to run a computer model for the whole atmosphere at the molecular level!
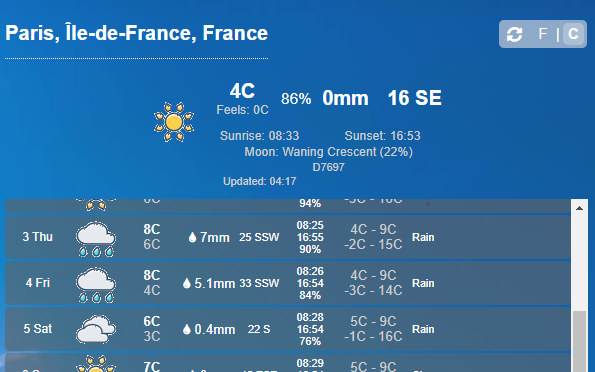
For the sake of practical comparison, here is a weather forecast screenshot taken from the Visual Crossing Weather Data Query page.
For the sake of practical comparison here is a weather forecast screenshot taken from the Visual Crossing Weather Data Query page.

Our example is to compare two different forecast styles for 15 days in the future. In this example, we will choose Valentine’s Day 2020, which is 2 weeks after the date of this article’s creation. The forecast is telling us that the temperature will range between 35 and 50F. It is also telling us that it may get 0.9 inches of rain.
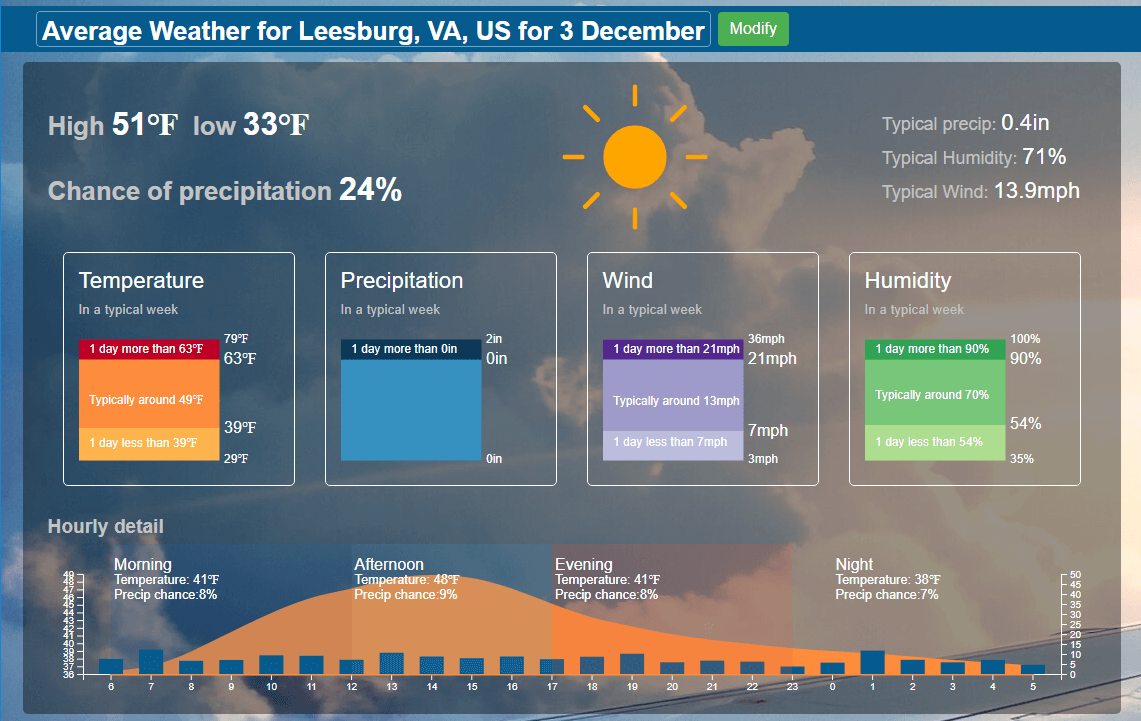
Now let’s take a look at a historically based average scenario. Here is a query using the Visual Crossing Average Weather tool.
These ‘typical’ weather conditions are built from 30 years’ worth of data, and you can see it shows a wide variation of possible temperatures ranging from 21-77F. Even in the predominant statistical area that represents 5 out of 7 days per week, the daily maximum temperature ranges about 25F.
As for Precipitation, it simply tells us that you can expect it to rain once a week. From averages, though, we can see that the Temperature is statistically likely to be around 42F. This is not far off from our 15-day forecast, and if you are tracking this over the years, the two different calculations will eventually agree with each other.
“The accuracy of a five-day forecast nowadays is comparable to that of a three-day forecast about 20 years ago, and that each decade, we gain about a day’s worth of skill. Essentially, today’s three-day forecasts are as precise as the two-day forecast of ten years ago.” – Jon Shonk Research scientist, University of Reading
Things are improving!
Different Types of Weather
One note to keep in mind is that we are focusing on temperature, which is a consistent variable that you can track and average over time with high rates of sampling for every single location on Earth. Rain and Snow are much harder.
The Historical Averages can only give you general guidance in most places unless you are forecasting an area that has rainy seasons consistently. Without consistent rainfall to compile a history of, only a 15-day forecast can guide you for a specific day’s chance of precipitation.
TLDR… which weather forecast approach is best?
To determine what is best here, we have to find which tool is best for the intended purpose.
15-day Forecast – While everyone agrees that the 15-day forecast can be inaccurate, it still is the only way to find guidance on what general meteorological conditions are leaning toward for a specific day in the near future. Remember, ‘wrong’ may only be a few degrees, whereas the Historical Analysis will give you a very wide range of temperatures to consider.
Historical Averages – If no forecast is available, then a statistical weather forecast is your only choice. But there is a role for them to play even within the 15-day window, which focuses entirely on your needs. If you are planning a trip, it is good to know what is possible vs what is likely given current conditions.
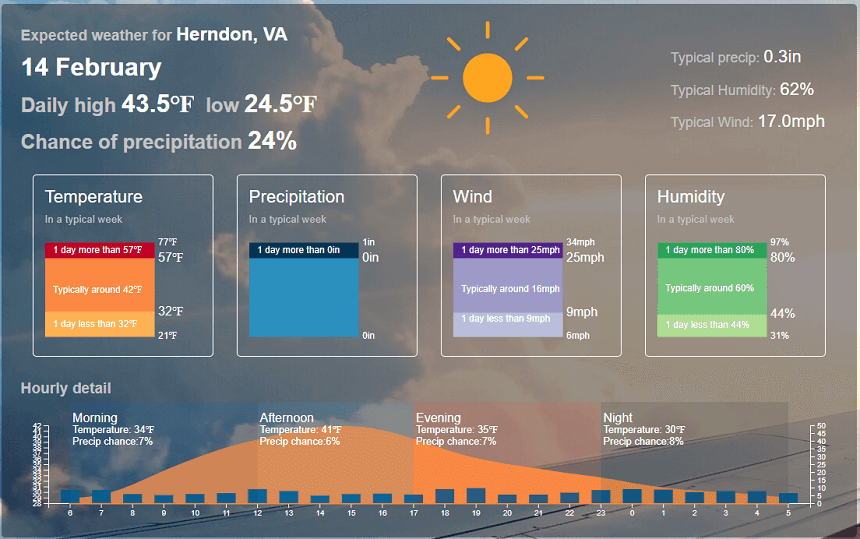
February 14th may get between 57 and 70F 1 out of 7 days in Herndon, VA. This is greatly helpful for planning purposes. The 15-day forecast won’t tell you this. Also, if you are planning a longer visit than any single day, your chances of hitting the average weather start to even out statistically.
If knowing the exact weather is critical to your usage, such as a business or government use scenario, we recommend using both. Understand what is likely, utilize the variances or inaccuracy, but also understand from historical averages what is possible.
Knowing the complete picture of odds is invaluable for planning, especially longer-term and for longer time intervals.
FAQs: How to Find the Best Long-Range Weather Forecast?
How accurate are long-range weather forecasts beyond 7 days?
Long-range weather forecasts (beyond 7 days) are increasingly useful, but their accuracy naturally decreases with time. According to NOAA, a 5-day forecast is about 90% accurate, a 7-day forecast around 80%, and beyond that, forecast accuracy declines significantly. However, “accuracy” isn’t binary—it depends on how close the result is to real conditions.
For example, if a 10-day forecast is off by a few degrees, that may still be actionable for most planning needs like weddings, sporting events, or outdoor parties.
Visual Crossing offers 15-day model-based forecasts, updated regularly using the latest global weather models, giving users the best available view of conditions across the Plains, Gulf Coast, and beyond.
While no long-range outlook is perfect, Visual Crossing’s forecast data is clear, easy to interpret, and enhanced with current and historical model comparisons to guide smarter decisions.
What’s the difference between forecast data and historical weather averages?
Forecast data predicts future weather using atmospheric models. It tells you what is likely to happen in the coming days based on current weather systems, pressure maps, and model runs. Visual Crossing provides 15-day forecasts that show high/low temperature ranges, chance of rain, and precipitation totals.
In contrast, historical weather averages—or climatology—are based on 30+ years of past weather data for a given date and location. These averages tell you what normally happens on, say, February 14th in Herndon, VA.
Visual Crossing’s tools let you access both forecast charts showing likely weather conditions for next week and statistical weather averages to see what’s typical for your event or planning window. Used together, they offer a complete picture of what’s possible and probable.
When should I rely on typical weather data instead of a forecast?
Rely on historical averages when forecast data is unavailable or uncertain, especially when you’re planning something weeks or months in advance. If your event is beyond the 15-day window, a long-range forecast may not exist or may be too inconsistent.
Visual Crossing’s historical averages are based on decades of climatological data, showing you likely temperature ranges, average rainfall, and how often showers typically occur during that week.
For example, if you’re planning a wedding in mid-February, averages might show that 5 out of 7 days are dry and temperatures normally range from 40–60°F in your area. That’s valuable insight even without a specific forecast.
You’ll know what’s normal—and can better plan for what might occur, especially for events in the East, Canada, or the Rockies, where systems can vary widely by region.
What’s the best tool for a 15-day weather forecast?
The best tool is one that combines ease of access with reliable data. The Visual Crossing 15-day forecast provides a clean, visual summary of temperature, precipitation, and cloud cover for every day in the 2-week window.
Unlike other services, which may limit resolution or data access without payment, Visual Crossing gives both casual and professional users access to detailed daily and hourly forecasts, including expected rainfall, temperature highs/lows, and more.
Forecast results are displayed in an easy-to-understand chart format and can also be downloaded for deeper analysis. Whether you’re using the site to learn, pick a date, or plug results into your business system, Visual Crossing offers free access to high-resolution, globally consistent forecast point data for any state, region, or city worldwide.
Can I trust precipitation predictions in long-range forecasts?
Rain and snow predictions are inherently more volatile than temperature. While temperature patterns generally shift gradually, precipitation can vary significantly even within the same day.
Visual Crossing’s 15-day forecast includes precipitation estimates, such as 0.9 inches of expected rain, and a calculated chance of rain. While these predictions are useful, it’s wise to pair them with historical averages.
For example, averages may show it rains 1 day per week in your location during early spring. So if the forecast suggests rain on your planned Saturday, but the odds from history are low, you might be safer planning the event with flexible options.
Forecast accuracy improves as the target date gets closer, so Visual Crossing allows you to track changing forecasts while also displaying how your date fits within the normal climatological patterns.
How can I use both forecast and historical data for better planning?
Combining the two gives you the most informed overview. Use the 15-day forecast to see short-term trends and possible highs/lows, while historical data fills in the gaps for what has typically occurred over the years.
For instance, if you’re organizing an event two weeks from now, Visual Crossing lets you compare the forecast (e.g., 48°F with rain) with historical results for that day (e.g., average high of 50°F and 1-in-7 chance of rain).
That extra context helps you plan backup options, set expectations, and understand the range of possibilities. Whether you’re planning in the middle of winter or tracking temperature shifts during a cold front, the ability to layer real-time forecast data with climatology gives you a far more powerful planning tool than using either one alone.